Nivetha R, Sivagami A, Aishwarya R, Gobinathan S, Kumaravel K S.
Department of Pediatrics, Govt. Mohan Kumaramangalam Medical College, Salem, India.
ADDRESS FOR CORRESPONDENCE
K.S.Kumaravel, 191A, Shankar Nagar, Salem, Tamil Nadu, India. PIN: 636 007.
Email: kumaravelks@rediffmail.com | | Abstract | Background: The American Academy of Pediatrics (AAP) has recommended a mean sound level of less than 45 dB in Neonatal Intensive Care Units (NICU). This study aims to estimate the baseline sound levels in level III of the NICU and implement a quality improvement initiative to reduce the sound level by at least 10 to 15% within a four-week time frame.
Methods: This was a prospective, quasi-experimental study conducted to evaluate the efficacy of a multimodal noise-reduction bundle in the Level III NICU and used an interrupted time-series design across four iterative Plan-Do-Study-Act (PDSA) cycles.
Results: The mean baseline noise level in level 3 was 59.3±6.71 dB. The contributors to noise levels were classified into 3 categories: People, Environment, and Equipment. The major interventions included were noise education, implementation of ‘Quiet Hour’, appointment of ‘Noise Counsellor’, shifting of the handover procedure outside Level 3, placing posters and signage, minimising the alarm volumes, and quicker response to alarms. The mean noise levels in cycles 1, 2, 3, and 4 were 51.3±5.19 dB, 50.9±4.87dB, 55.4±11.1dB, and 50.2±10.9 respectively, with a 15.91% reduction in cycle 4 from baseline. On analysis of the baseline shift-wise noise levels, the afternoon shift had significantly higher mean noise levels than the other shifts. After interventions, significant improvements were observed during the Night Shift and Afternoon Shift.
Conclusion: In this study, we have demonstrated that noise levels in Level 3 of NICUs can be significantly reduced through a multimodal noise reduction bundle. | | | | Keywords | | Hearing loss, Developmentally supportive care, Noise, Neonate, Night shift. | | | | Introduction | Advancements in neonatal care, such as monitoring systems and ventilators, also introduce harmful noises for neonates. The American Academy of Pediatrics (AAP) has recommended a mean sound level (Leq) of less than 45 dB in Neonatal Intensive Care Units (NICU).1 The AAP guidelines further recommend that the sound level should not exceed 50 dB for more than 10% of the measurement time (L10), and the maximum sound levels (Lmax) should not exceed 65 dB. Exposure to higher sound levels has been associated with problems such as increased heart rate, poor sleep, seizures, poor neurodevelopmental outcomes and growth, hearing impairment, and increased intracranial pressure.2,3 The preterm neonates are particularly vulnerable to these problems because of the immaturity of the nervous system and poor self-regulatory mechanisms.4 The various sources of noise in the Neonatal Intensive Care Unit (NICU) include conversations of staff and parents, alarms from monitors and ventilators, phones, door closures, and other sounds of equipment like nebulisers.5 In developing countries, neonatal care is more focused on clinical management, and the sound levels in neonatal units are often unmonitored. As the concept of developmentally supportive neonatal care advances, the deleterious effects of noise in the NICU need to be addressed vigorously.6
The sound levels also vary depending on the level of care.7 In level 3, noise is higher due to ventilators and other respiratory support systems, whereas in level 2, it is primarily from monitors. Few studies have specifically examined noise levels in level 2 and have demonstrated a significant reduction in noise with the implementation of a quality improvement project.8 Many studies have shown that, most of the time, noise levels in their NICUs exceeded the AAP limit, and these studies have implemented various evidence-based strategies to reduce noise levels.9,10 This study aims to estimate the baseline noise levels in level 3 of the NICU and implement a quality improvement initiative to reduce the sound level by at least 10 to 15% within a four-week time frame. | | | | Methods | This prospective, quasi-experimental, pre-post intervention, mixed-methods study evaluated the efficacy of a multimodal noise-reduction bundle in Level 3 of an NICU at an urban tertiary care hospital. The study used an interrupted time-series design across four iterative Plan-Do-Study-Act (PDSA) cycles conducted from January 2026 to February 2026. The neonatal unit of the study hospital has 9 beds in Level 3 of the NICU. It is staffed with 4 pediatricians and 8 neonatal nurses working in three shifts (morning, afternoon, and night). The average bed occupancy is more than 90% throughout the year, and it receives sick neonates born both intramurally and extramurally. All beds are equipped with ventilators, multipara monitors, infusion pumps, and phototherapy units. Approval from the Institutional Human Ethics Committee was obtained.
Baseline measurements
The baseline noise measurements were conducted on a Monday (05/01/2026) in January 2026. We selected Mondays for the assessment as they had peak clinical activity and peak case load. So, we hypothesized that reducing noise levels on days of peak clinical load would also reduce noise levels on other days. The device used in the study was the Mastech® MS 6701 RS-232/data logger, which was used in previous studies.9,11 The device had a measurement range of 30-130 dB (A-weighted), with an accuracy of ±1.5 dB, and was calibrated before the study. The noise levels were measured by placing the device in the centre of the level 3 unit of the NICU and connecting it to a computer. The baseline measurements were recorded continuously every 5 seconds throughout the day, and the mean sound levels were recorded at the end of each shift.
The Silent NICU Initiative:
We undertook this initiative in the framework of a Plan-Do-Study-Act (PDSA) cycle.
Phase 1: Plan (The foundation) Since noise is always the end product of multiple causes, we formed a multi-disciplinary team consisting of Pediatricians, Nurses, biomedical engineers, and hospital workers. For this initiative, we set a reasonable target of reducing the sound levels by at least 10 to 15% within 4 weeks. We then planned a Root Cause Analysis (fishbone analysis) of the sources of noise, in which sound levels of people, environment, and equipment were measured.
Phase 2: Do (Interventions) The 3 targeted interventions that were planned are behavioural, environmental, and technical modifications.
Phase 3: Study (Analysis) After the intervention, the noise levels were analysed and compared with the baseline.
Phase 4: (Act) To consolidate the gains achieved from this initiative and to incorporate them into a standard of care in our NICU that will be sustainable.
These changes were undertaken in 4 cycles, and after every cycle, noise level measurements were taken and analysed.
Statistical analysis
Data were analysed using R software. Continuous variables, including NICU noise levels, were presented as mean ± standard deviation. Normality of the data was assessed using the Shapiro–Wilk test. Mean differences between cycles were calculated to describe trends in noise reduction, and their statistical significance was analysed using a paired t-test. Shift-wise mean noise levels were analysed to assess variation across baseline and PDSA cycles. To evaluate the efficacy of the Silent NICU Initiative across the cycles, a one-way Analysis of Variance (ANOVA) was performed to compare mean sound levels across the Baseline and four subsequent PDSA cycles. Separate ANOVA tests were conducted for the Total Daily Mean sound levels and for each of the three shifts (Morning, Afternoon, and Night) to account for shift-wise variations. Post-hoc comparisons between the baseline and individual cycles were conducted to identify specific points of improvement. A p-value of <0.05 was considered statistically significant for all analyses. | | | | Results | Root cause analysis: The mean noise levels across the study cycles are shown in Table 1. The mean baseline noise level in level 3 of the NICU was 59.3 ± 6.71 dB. Because noise is the collective end product of multiple factors, we analysed its contributors individually. The contributors to noise levels were categorised into 3 headings: people, environment, and equipment. They were measured before implementation of the initiative and are depicted in Figure 1. We observed that even the slightest sound, like the door closure or the staff chatter, recorded a noise level of up to 50 dB. We also observed that the noise levels produced by various monitors vary from 35 dB to 65 dB. We observed that the alarm sound of a High Frequency Oscillatory Ventilator (HFOV) unit was the loudest (80 dB), even after minimising the alarm volume to 10%. The trolley movement and shifting of the X-ray unit were associated with a noise level of up to 70 dB. We also analysed the shift-wise noise levels (Table 2) and noted that the afternoon shift had significantly higher mean noise levels than the other shifts. We then analysed the shift-wise noise levels in each shift and found that during nursing/resident handover, the noise level surged to up to 75 db. Also, during every new admission into the unit, there was a surge in noise levels.
Figure 1. Root cause analysis of noise in NICU.
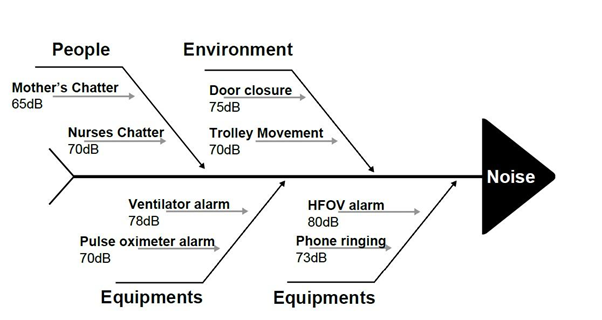
Table 1. Mean NICU Noise Levels Across Study Phases.
| Study Phase |
Mean Noise Level ± SD (dB) |
| Baseline |
59.3±6.71 |
| Cycle 1 |
51.3±5.19 |
| Cycle 2 |
50.9±4.87 |
| Cycle 3 |
55.4±11.1 |
| Cycle 4 |
50.2±10.9 |
| Mean difference between baseline and cycle 4* |
9.44 |
*P<0.001, Paired t-test
Table 2. Mean shift-wise noise levels across the study cycles.
| Mean shift-wise noise levels (dB) |
| |
Baseline |
Cycle 1 |
Cycle 2 |
Cycle 3 |
Cycle 4 |
| Morning |
59.41 |
53.07 |
51.60 |
55.15 |
54.66 |
| Afternoon |
62.02 |
51.49 |
49.81 |
55.37 |
56.40 |
| Night |
58.85 |
50.21 |
50.48 |
56.12 |
51.46 |
| One-Way ANOVA Summary of Sound Level Reductions Across the Cycles* |
| Source of Variation |
Mean Reduction (dB) |
df (between, within) |
F-statistics |
p-value |
Significance |
| Total Daily Mean |
7.52 |
(4,5) |
10.68 |
0.011 |
Significant |
| Morning Shift |
4.75 |
(4,30900) |
462.87 |
<0.001 |
Highly Sig. |
| Afternoon Shift |
5.62 |
(4,25882) |
1140.53 |
<0.001 |
Highly Sig. |
| Night Shift |
7.38 |
(4,41700) |
1691.21 |
<0.001 |
Highly Sig. |
ANOVA – Analysis of Variance, *Reduction calculated as Baseline vs Cycle 4. df-degree of freedom.
Interventions: After analysing the contributors, we implemented the following interventions over a span of 2 weeks, and noise-level measurements were taken on the subsequent Monday (19/01/2026) for cycle 1. The summary of the interventions is tabulated in Table 3.
Table 3. Summary of interventions.
| 1. Behavioural modifications |
1. Noise education for staff and parents.
2. Implementation of ‘Quiet Hour’.
3. Appointment of ‘Noise Counsellor.’
4. Shifting of the handover procedure outside Level 3.
5. Rewarding the staff for maintaining lower noise levels.
6. Placing posters regarding the initiative and circulating them in social media groups of the NICU.
|
| 2. Environmental modifications |
1. Softer door closures.
2. Placing the mobile phones in vibration modes.
3. Keeping the fan speed of the air-conditioner to a lower speed.
|
| 3. Technical modifications |
1. Minimising the alarm volumes.
2. Quicker response to alarms.
3. Shifting to visual alarms wherever possible.
|
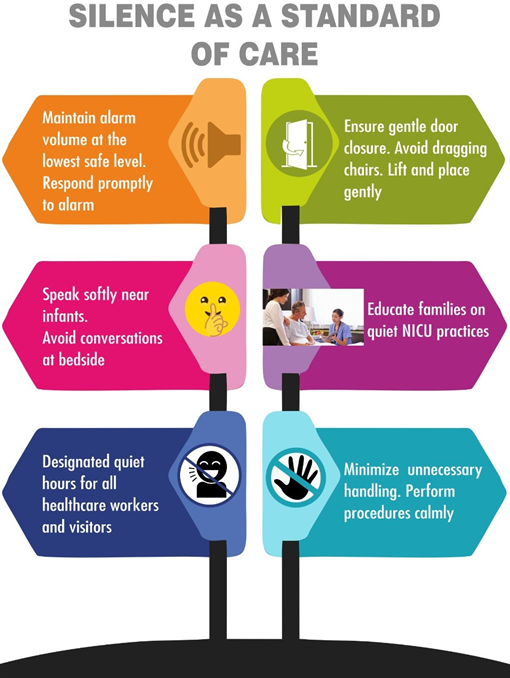
1. Behavioural modifications: Staff and parents' education about the hazards of noises were done. The authors conducted priming sessions every day for the nurses, residents, and parents. Posters and signage were placed in prominent places in the NICU and also circulated in the social media groups of the NICU (Figure 2). We also implemented ‘quiet hours’ in every shift, where complete silence was observed by the staff members for one or two hours with dimmed lights. However, it could not be implemented in the morning shifts, as the NICU was always busy in the mornings. So, we restricted the ‘quiet hours' to afternoon and night shifts alone. As the nursing and resident handover was associated with louder noises in the baseline analysis, we shifted these procedures to outside of Level 3. We also appointed a senior staff nurse as a ‘Noise Counsellor’ who monitored other staff members. She counselled the residents and nurses who were making louder noises. The staff members were rewarded with small gifts when noise levels were low during their shifts.
Figure 2. Posters placed in NICU.
2. Environmental modifications: We replaced the door closures with softer ones. We made serious attempts to silence the mobile phones of all the staff members of the NICU and advised them to place them in vibration mode. However, the greatest challenge we faced was silencing the phones of the visiting consultants from other departments, who kept changing every day. As the air conditioner was associated with louder noises, we kept the fan speed of the air conditioner to the minimum speed to reduce the noise.
3. Technical modifications: This part of the implementation was the most difficult one. We sought the help of the biomedical engineers to quieten the alarms and shift to visual alarms. Many of the monitors and ventilators had no option to permanently mute the alarms. They only had a volume reduction option, but the alarm sounds could not be permanently muted, even though they had a visual alarm. We enforced a faster response to the equipment's alarm sounds. We also ensured the safety of the neonates by not missing out important alarms from ventilators and other equipment.
Impact of interventions: The mean noise level in cycle 1 was 51.3 ± 5.19 dB, a drop of 6.0 dB from the mean baseline noise level. On analysis of the shift-wise mean sound levels, the afternoon shift showed a significant reduction compared to the other shifts, due to the handover procedure being moved outside Level 3. The implementation of quiet hours also reduced noise levels in the afternoon and night shifts. Although the reduction was achieved to some extent, it did not meet the AAP guideline of 45 dB. We therefore reinforced the behavioural modifications more rigorously in the subsequent cycles, on subsequent Mondays, until the threshold noise levels were achieved. The mean noise levels achieved in the subsequent cycles are shown in Tables 1 and 2. A transient escalation in noise levels was observed during Cycle 3. This trend appeared to be multi-factorial, possibly due to a surge in patient census on the observation dates, coupled with a decline in adherence to the sound-reduction protocols (intervention fatigue). Hence, before cycle 4, a more rigorous implementation of behavioural modifications was undertaken. The cycle 4 mean noise levels were 50.2 ± 10.9 dB, 15.91% lower than the baseline values, but still higher than the AAP threshold level.
A one-way ANOVA test revealed a statistically significant difference in mean sound levels across the cycles for the total daily average (F(4,5) = 10.68, p = 0.011). Shift-wise analysis further confirmed the impact of the interventions, with marked improvements observed during the Night Shift (F(4,41700) = 1691.21, p < 0.001) and the Afternoon Shift (F(4,25882) = 1140.53, p < 0.001). These high F-statistics indicate that the variance in sound levels between the baseline and PDSA cycles was substantially greater than the variance within the groups, confirming the efficacy of the interventions.
We finally made this initiative a standard operating procedure in the unit, with all newly joined Doctors and Nurses briefed on maintaining adequate sound hygiene. Periodic noise level measurements were performed and audited by the unit head. Whenever a surge in noise levels was noticed, the ‘Noise Counsellor’ deployed a series of corrective interventions to restore noise levels to threshold levels. | | | | Discussion | The mean baseline noise level in our NICU was 59.3 ± 6.71 dB, which was higher than the AAP threshold level of 45 dB. Many studies globally have reported that their mean noise levels are higher than the AAP guidelines.8,12,13 Since noise is the end product of many sounds, we employed a multimodal noise reduction bundle. A similar study, which also employed a noise reduction bundle, demonstrated a reduction of 25% in noise levels after 4 months of implementation.9 We observed that the staff chatter was associated with noise levels up to 70 dB in our NICU. Few studies have also reported similar noise levels and have demonstrated that noise levels are significantly reduced after activity modification.14,15 In a study by Wang et al, a sound-activated noise meter placed inside the patient care areas, with a threshold of 50 dB, acted as a deterrent and brought the noise levels to significantly lower levels.10
We observed a large diurnal variation in noise levels, with increased noise levels in the morning shifts. In a study by Joshi et al, the mean baseline noise level in the morning, afternoon, and night shifts was 77.89 dB, 73.30 dB, and 69.11 dB, respectively, which was higher than the present study.16 Our NICU is a tertiary referral centre that is always busy in the mornings, and attaining the AAP threshold level is a great challenge. However, there was a significant reduction in the noise levels in all three shifts in cycle 4.
After cycle 4, noise levels in our NICU reduced by 15.91% to 50.2 ± 10.9 dB. However, they were still above the AAP threshold level. A study by Rangasamy et al reported a reduction in noise levels by 21% in day shifts and 25% in night shifts.9 Studies by Chawla et al and Hull et al reported 20% and 13.7% reduction from baseline, in their studies.2,17 The appointment of a ‘Noise Counsellor’ had a great impact on reducing noise levels in our study. A study by Hu et al designated a ‘noise supervisor’ and reported to have had a positive impact on the implementation of the noise reduction bundle.8 The shifting of the handover procedure also contributed to a significant reduction in noise levels in our study. A similar observation was made in another study.9 The contributors to noise in every NICU are different, and the noise reduction bundle has to be unique to cater to the needs of that particular NICU.
The device used in the study was Mastech® MS 6701 RS-232/data logger. Though such devices are used for research purposes, many smartphone applications are available that can be used to measure the noise levels.11 The accuracy of the mobile application depends on the microphone in the smartphone and the quality of the smartphone used. Though the accuracy of these applications is questionable, they can provide a rough estimate of noise levels and can be used to monitor the trends in noise levels in the NICU over a period of time.
This study had a few limitations. The noise level assessments were unmasked, creating a possibility of observer bias, where staff consciously reduced their noise (Hawthorne Effect). However, we utilized continuous, round-the-clock data collection to minimize this bias. The prolonged duration of monitoring ensures that the data reflects authentic clinical activity, as the ability to maintain altered behavior typically diminishes over the course of an entire shift. Second, we measured noise levels only on Mondays. Lastly, noise levels in Levels 1 and 2 were not measured, as our baseline data showed they were not significantly higher than the AAP threshold levels. | | | | Conclusion | | In this study, we have demonstrated that noise levels in Level 3 of NICUs can be significantly reduced through a multimodal noise reduction bundle. While sound levels remained slightly above the AAP-recommended 45 dB threshold, the bundle significantly improved the acoustic stability of the NICU environment by reducing both mean daily and shift-wise noise levels. | | | | Compliance with Ethical Standards | | Funding None | | | | Conflict of Interest None | | |
- American Academy of Pediatrics Committee on Environmental Health (1997) Noise: a hazard for the fetus and newborn. Pediatrics 100:724-727. [CrossRef]
- Hull W, Wright K. A Quality Improvement Pilot Project for Noise Reduction in the NICU. Adv Neonatal Care 2023; 23: 401-408. [CrossRef] [PubMed]
- Ahamed MF, Campbell D, Horan S, Rosen O. Noise Reduction in the Neonatal Intensive Care Unit: A Quality Improvement Initiative. Am J Med Qual 2018; 33: 177-184. [CrossRef] [PubMed]
- Almadhoob A, Ohlsson A. Sound reduction management in the neonatal intensive care unit for preterm or very low birth weight infants. Cochrane Database Syst Rev 2020; 1: CD010333. [CrossRef] [PubMed] [PMC free article]
- Das, S., Chakraborty, P., Bora, R. et al. Sound levels and its effect on physiology of low birth weight newborns in a special care newborn unit - a prospective observational study. Egypt Pediatric Association Gaz 71, 30 (2023). [CrossRef]
- Shah RH, Dangar RD. Developmental supportive care in preterm and low birth weight neonates. Int J Contemp Pediatr [Internet]. 2025 Jul. 24. [CrossRef]
- Levy GD, Woolston DJ, Browne JV. Mean noise amounts in level II vs level III neonatal intensive care units. Neonatal Netw 2003;22:33-8. 10.1891/0730-0832.22.2.33. [CrossRef] [PubMed]
- Hu L, Liu Q, Yuan H, Lu C, Zhou W. Efficacy of noise reduction bundle in reducing sound levels in a Level II neonatal care unit in China. Transl Pediatr. 2020 Dec;9(6):750-756. [CrossRef] [PubMed] [PMC free article]
- Rangaswamy DR, Kamble N, Veeramachaneni A. Quieting the neonatal intensive care unit: A quality improvement initiative. World J Clin Pediatr 2024; 13(3): 96018. [CrossRef] [PubMed] [PMC free article]
- Wang D, Aubertin C, Barrowman N, et al. Examining the effects of a targeted noise reduction program in a neonatal intensive care unit. Arch Dis Child Fetal Neonatal Ed 2014;99:F203-8. 10.1136/archdischild-2013-304928. [CrossRef] [PubMed]
- Rangaswamy DR, Kamble N. Utility of Smartphone Application to Detect Noise in NICU. Indian Journal of Pediatrics. 2024 Jul;91(7):760-. [CrossRef] [PubMed]
- Williams AL, van Drongelen W, Lasky RE. Noise in contemporary neonatal intensive care. J Acoust Soc Am 2007;121:2681-90. [CrossRef] [PubMed]
- Lasky RE, Williams AL. Noise and light exposures for extremely low birth weight newborns during their stay in the Neonatal Intensive Care Unit. Pediatrics 2009;123:540-6. [CrossRef] [PubMed]
- Hassanein SM, El Raggal NM, Shalaby AA. Neonatal nursery noise: practice-based learning and improvement. J Matern Fetal Neonatal Med 2013;26:392-5. [CrossRef] [PubMed]
- Kent WD, Tan AK, Clarke MC, et al. Excessive noise levels in the neonatal ICU: potential effects on auditory system development. J Otolaryngol 2002;31:355-60. [CrossRef] [PubMed]
- Joshi G, Tada N. Analysis of noise level in neonatal intensive care unit and post natal ward of a tertiary care hospital in an urban city. Int J Contemp Pediatr 2016;3:1358-61. [CrossRef]
- Chawla S, Barach P, Dwaihy M, Kamat D, Shankaran S, Panaitescu B, Wang B, Natarajan G. A targeted noise reduction observational study for reducing noise in a neonatal intensive unit. J Perinatol 2017; 37: 1060-1064. [CrossRef] [PubMed]
DOI: https://doi.org/10.7199/ped.oncall.2027.48
|
| Cite this article as: | | R N, A S, R A, S G, K S K. The Silent NICU Initiative: A Prospective Quality Improvement Study on the Impact of a Multimodal Noise Reduction Bundle. Pediatr Oncall J. 2026 Apr 27. doi: 10.7199/ped.oncall.2027.48 |
|